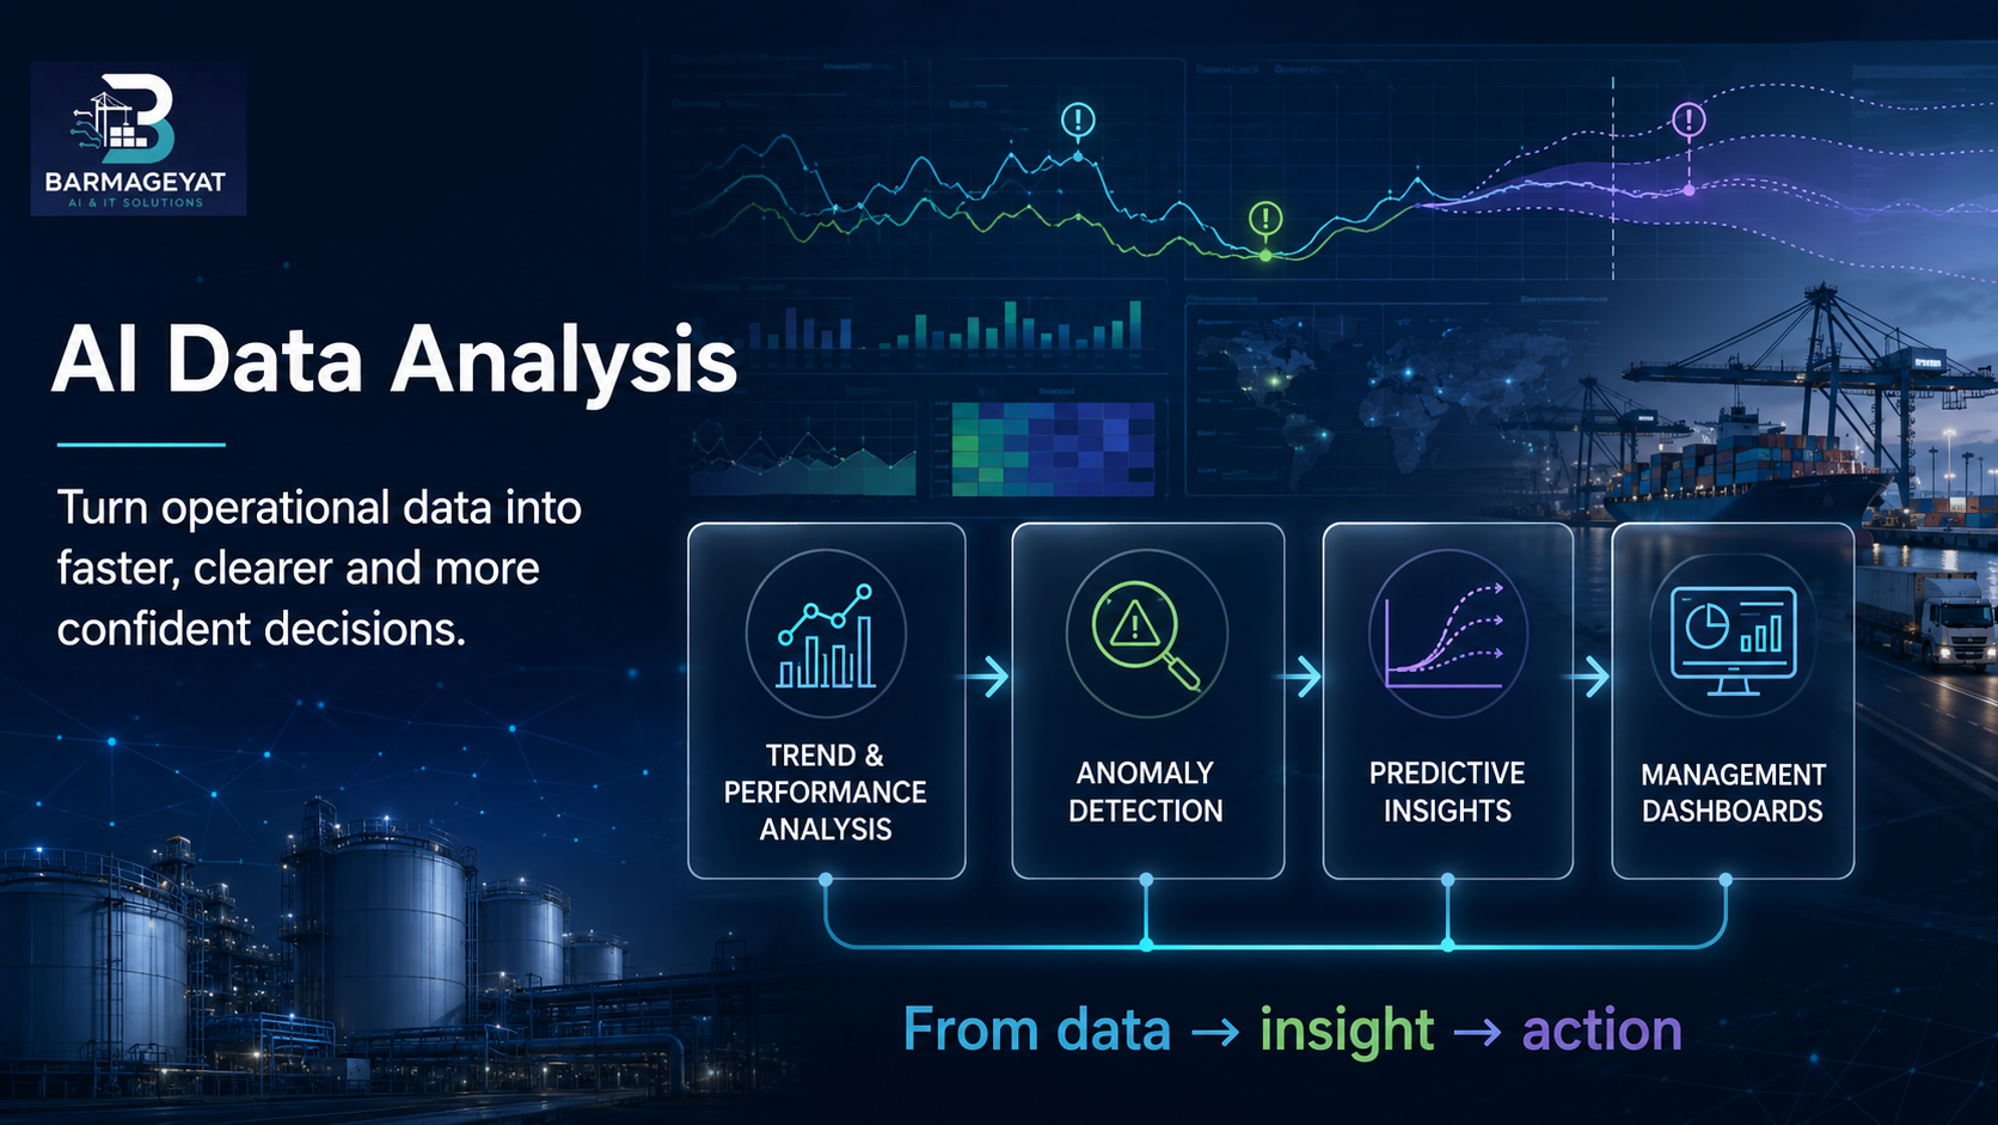
AI Data Analytics helps organizations transform operational data into faster, clearer and more confident decisions through trend visibility, anomaly detection, predictive insights and management dashboards.
AI Data Analytics is designed for organizations that need more than static reporting. It helps teams monitor performance, spot anomalies, understand emerging risks and present insights clearly to operations and management.
Track operational KPIs over time, compare performance across sites or teams, and surface meaningful changes in throughput, productivity, service levels or utilization.
Identify unusual patterns, exceptions and operational deviations early so teams can investigate issues before they escalate into delays, losses or customer-impacting events.
Use historical trends and event patterns to support forecasting, proactive planning and earlier intervention in areas such as congestion, resource needs or process bottlenecks.
Present insights through clear dashboards and decision views tailored to executives, department heads, operations managers and functional teams.
Barmageyat can connect operational systems, databases, spreadsheets, device data and workflow events into a clearer analytics layer that supports day-to-day control and long-term improvement.
AI Data Analytics is typically implemented as a focused analytics layer around the systems you already use. Barmageyat helps define the required KPIs, connect the data, structure the business rules and present the outputs in dashboards and actionable views.
This makes the solution suitable for ports, terminals, logistics operations, industrial businesses and other organizations that need to convert raw data into practical decisions rather than just static reports.
Monitor gate, yard, vessel or workforce-related KPIs to understand bottlenecks, peak periods, service performance and operational variation.
Aggregate operational alerts, attendance exceptions, camera events or process exceptions into a reviewable intelligence layer for faster action.
Give management a concise visual view of performance, risks, trends and opportunities instead of relying on disconnected spreadsheets and manual summaries.
Measure request volumes, handling times, recurring issues and service responsiveness to improve customer-facing operations.
Combine manpower planning and attendance data to better understand staffing levels, punctuality, coverage and operational readiness.
Create analytics packages around your own process, department or operational model, including custom rules, alerts, dashboards and reporting layers.
Talk to Barmageyat about building an analytics layer that helps your teams move from raw data to practical action.